The price of Dogecoin (DOGE) is trading between the most important resistance and support levels, which can determine the direction of the future trend
Signals on different DOGE timeframes do not give unambiguous results. Therefore, the movement of Dogecoin in the next few days will be important to determine the direction of the further trend.
Dogecoin is approaching the point of convergence of resistance and support
The coin of the Dogecoin project is one of the most recognizable "calling cards" of the crypto market and has many fans. Although it appeared in 2013 as a meme coin, many already believe that DOGE has outgrown the status of a simple meme.
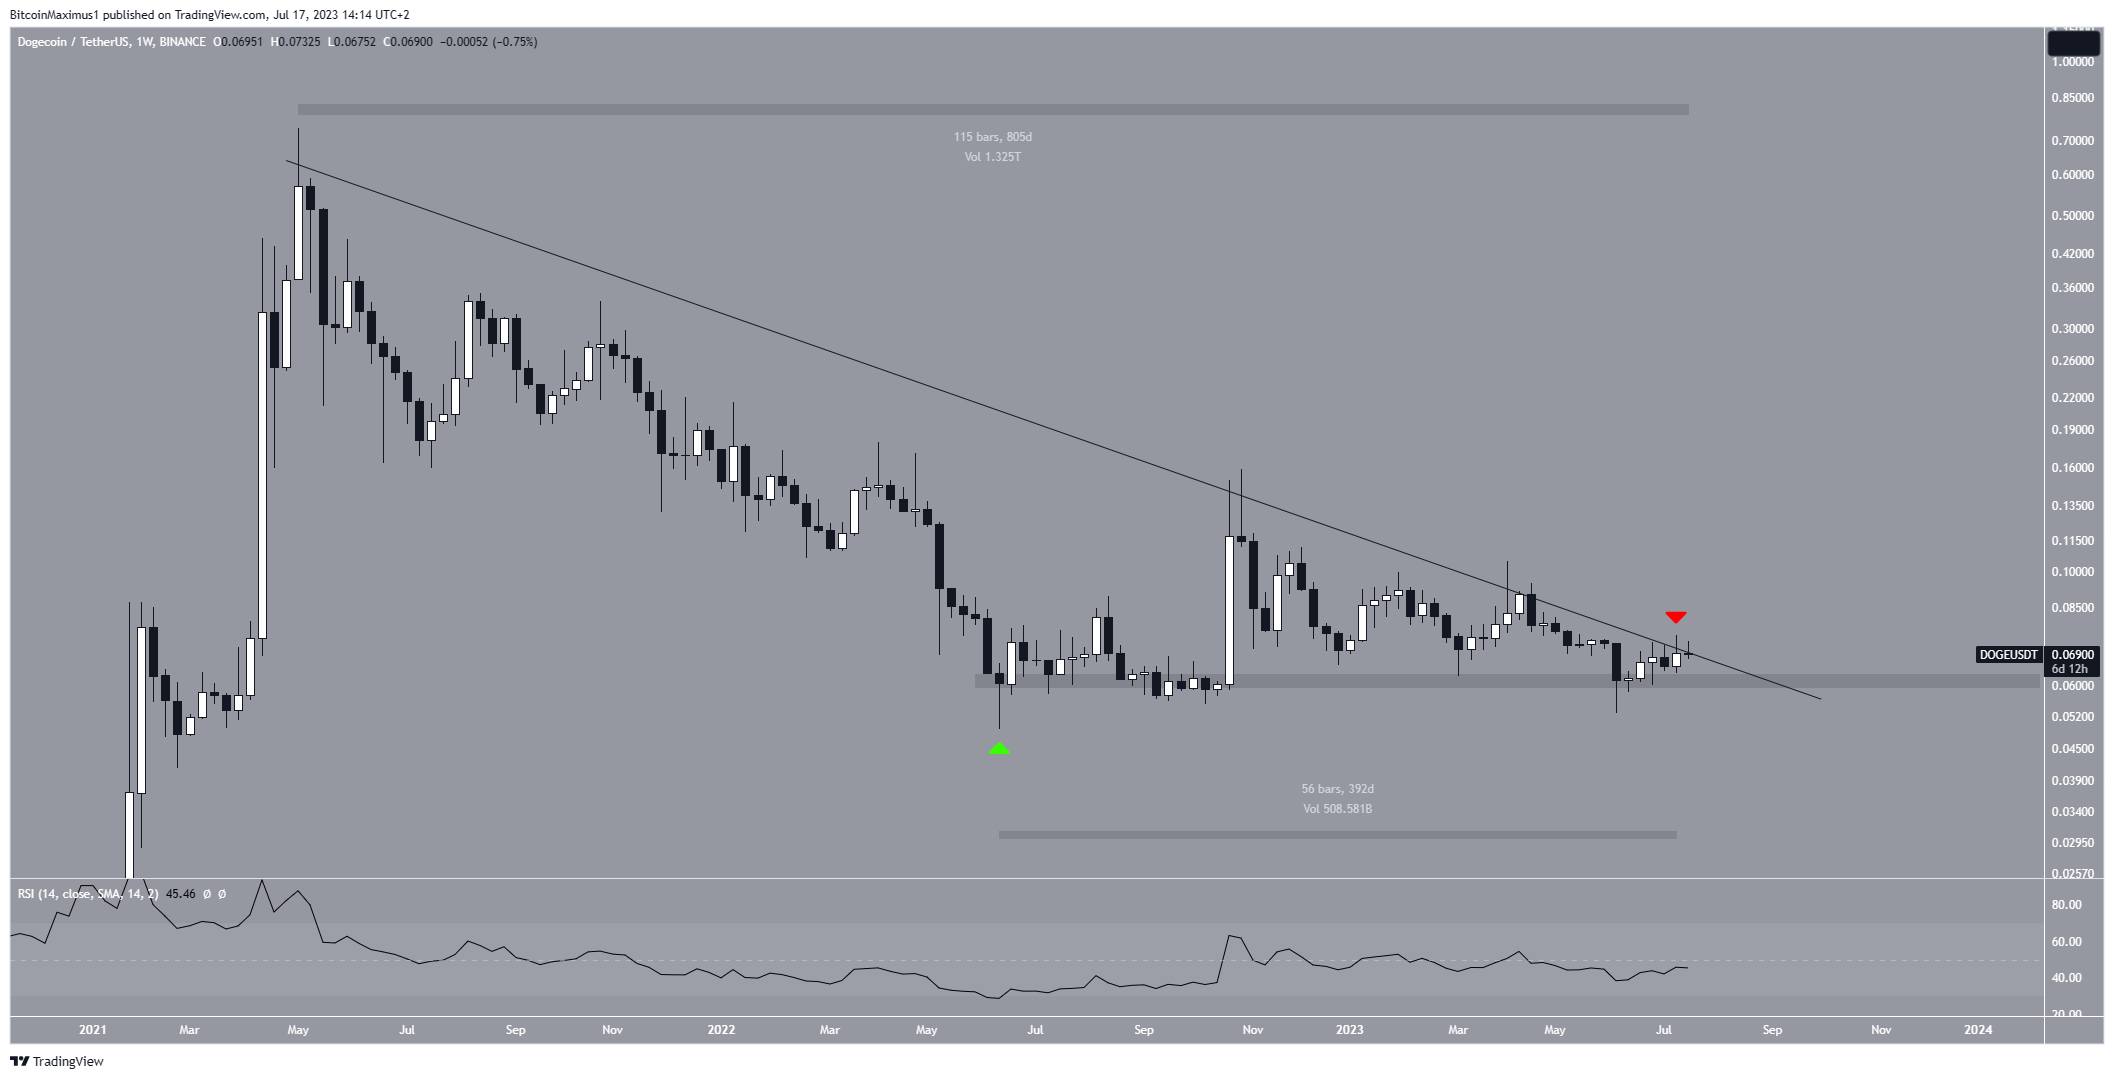
As the results of the technical analysis of the weekly chart show, the price of DOGE has been declining along the downward resistance line since reaching a high at $0.739 in May 2021. This decline led to a low of $0.049 in June 2022.
After that, the price of DOGE began to recover (green icon) and began to trade above the horizontal support level of $0.060. However, it has not yet overcome the long-term downward resistance line, which is 805 days old.
Last week, the token bounced off this resistance line (red icon), but the bulls are currently making another attempt to break through it.
In addition, the price is in close proximity to the area of convergence of the horizontal support level and the descending resistance line. This is a sign that she will soon have to make an important choice.

The weekly Relative Strength Index (RSI) does not make it possible to draw an unambiguous conclusion. Although this indicator is rising, it remains below the 50 mark, reflecting the uncertainty of the trend. To confirm the bullish trend, it is necessary for the RSI to rise above 50, and DOGE to make a bullish breakout of the descending resistance line.
DOGE Prediction: Bullish Breakout Doesn't Look Confirmed
Like the weekly timeframe, the daily chart also gives contradictory signals.
On the one hand, DOGE made a bullish breakout of the descending resistance line on June 22. After testing it for strength as a support (green icon), the token resumed growth. Moreover, the price returned to the horizontal support area of $0.065.
In addition, the RSI index has broken through its bearish trend line (green) and is now above the 50 level.
However, on the other hand, DOGE did not advance above the 0.382 Fibo resistance level of the retracement at $0.073. On the contrary, the price has bounced off this resistance and is now trading below it.
Thus, on the daily timeframe, it can also be seen that the price of DOGE is trading below an important resistance level, but above an important support level. As a result, the direction of the short-term breakout can also be determined by a longer-term trend.
As part of the long-term outlook, if the market breaks through the long-term resistance line, DOGE could rise to the next resistance at $0.15. However, in the event of a breakdown of long-term horizontal support, a sharp drop to the level of $0.030 may follow