
Dogecoin (DOGE) will bring traders "X" if it breaks through this resistance level
Date: 2023-08-04 Author: Karina Ziganova Categories: BLOCKCHAIN, IN WORLD
The price of Dogecoin (DOGE) has broken an important long-term resistance area. However, the upward movement that usually follows such breakouts has not yet begun.
However, readings on both the weekly and daily time frames support the potential upside, confirming the legitimacy of the breakout.
Dogecoin price bounces off long-term resistance
The technical analysis of the daily timeframe shows that since reaching an all-time high of $0.739 in May 2021, DOGE has been following a descending resistance line. The decline led to a low of $0.049 (marked with a green icon on the chart) in June 2022. After that, the price of Memcoin bounced and consolidated above the horizontal support level of $0.60.
On July 15, Dogecoin was able to break above the diagonal resistance line that had existed for 805 days. Breakouts of such long-term structures often lead to a significant increase in prices, indicating the end of the previous trend.
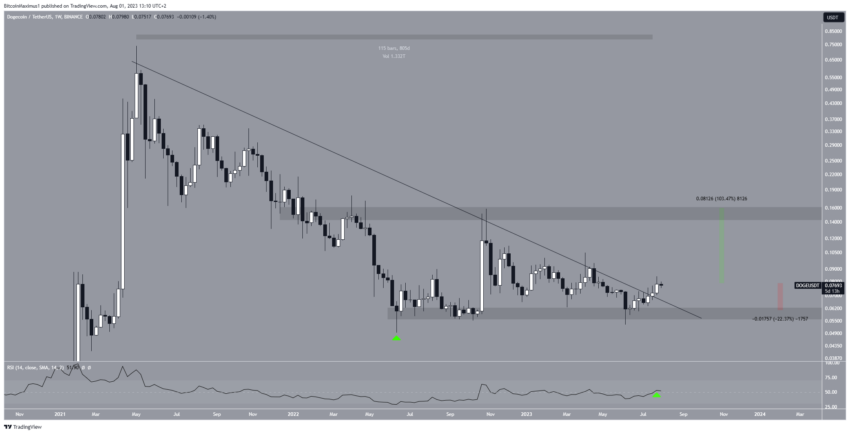
However, the upward movement has not yet begun, and the readings of the weekly Relative Strength Index (RSI) do not allow us to draw an unambiguous conclusion.
DOGE Price Prediction: Has a Bullish Reversal Begun?
The daily timeframe, meanwhile, is much more bullish. On June 22, the price of DOGE bounced off the descending resistance line and confirmed it as support, which led to an upward movement. After several attempts, the asset has successfully overcome the 0.382 Fibonacci resistance level at $0.075. It is currently trading below the 0.618 retracement level around $0.085.
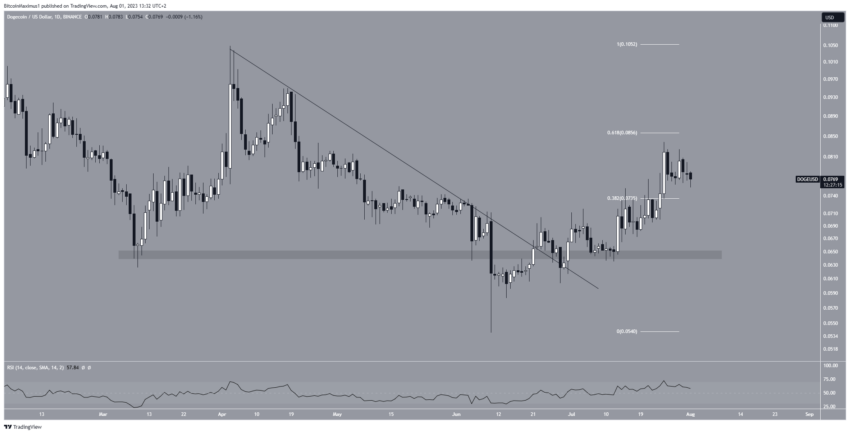
The 0.618 Fibonacci resistance level often acts as an upper/lower boundary if the move is corrective. A close above it would confirm the legitimacy of a long-term breakout and could lead to a rally towards the next long-term resistance at $0.15.
The daily RSI is above the 50 level and rising, supporting the continuation of the upward movement.
However, a close below the 0.382 Fibonacci level would mean that the trend is still bearish. In this case, the DOGE price could drop to long-term support at $0.060.


