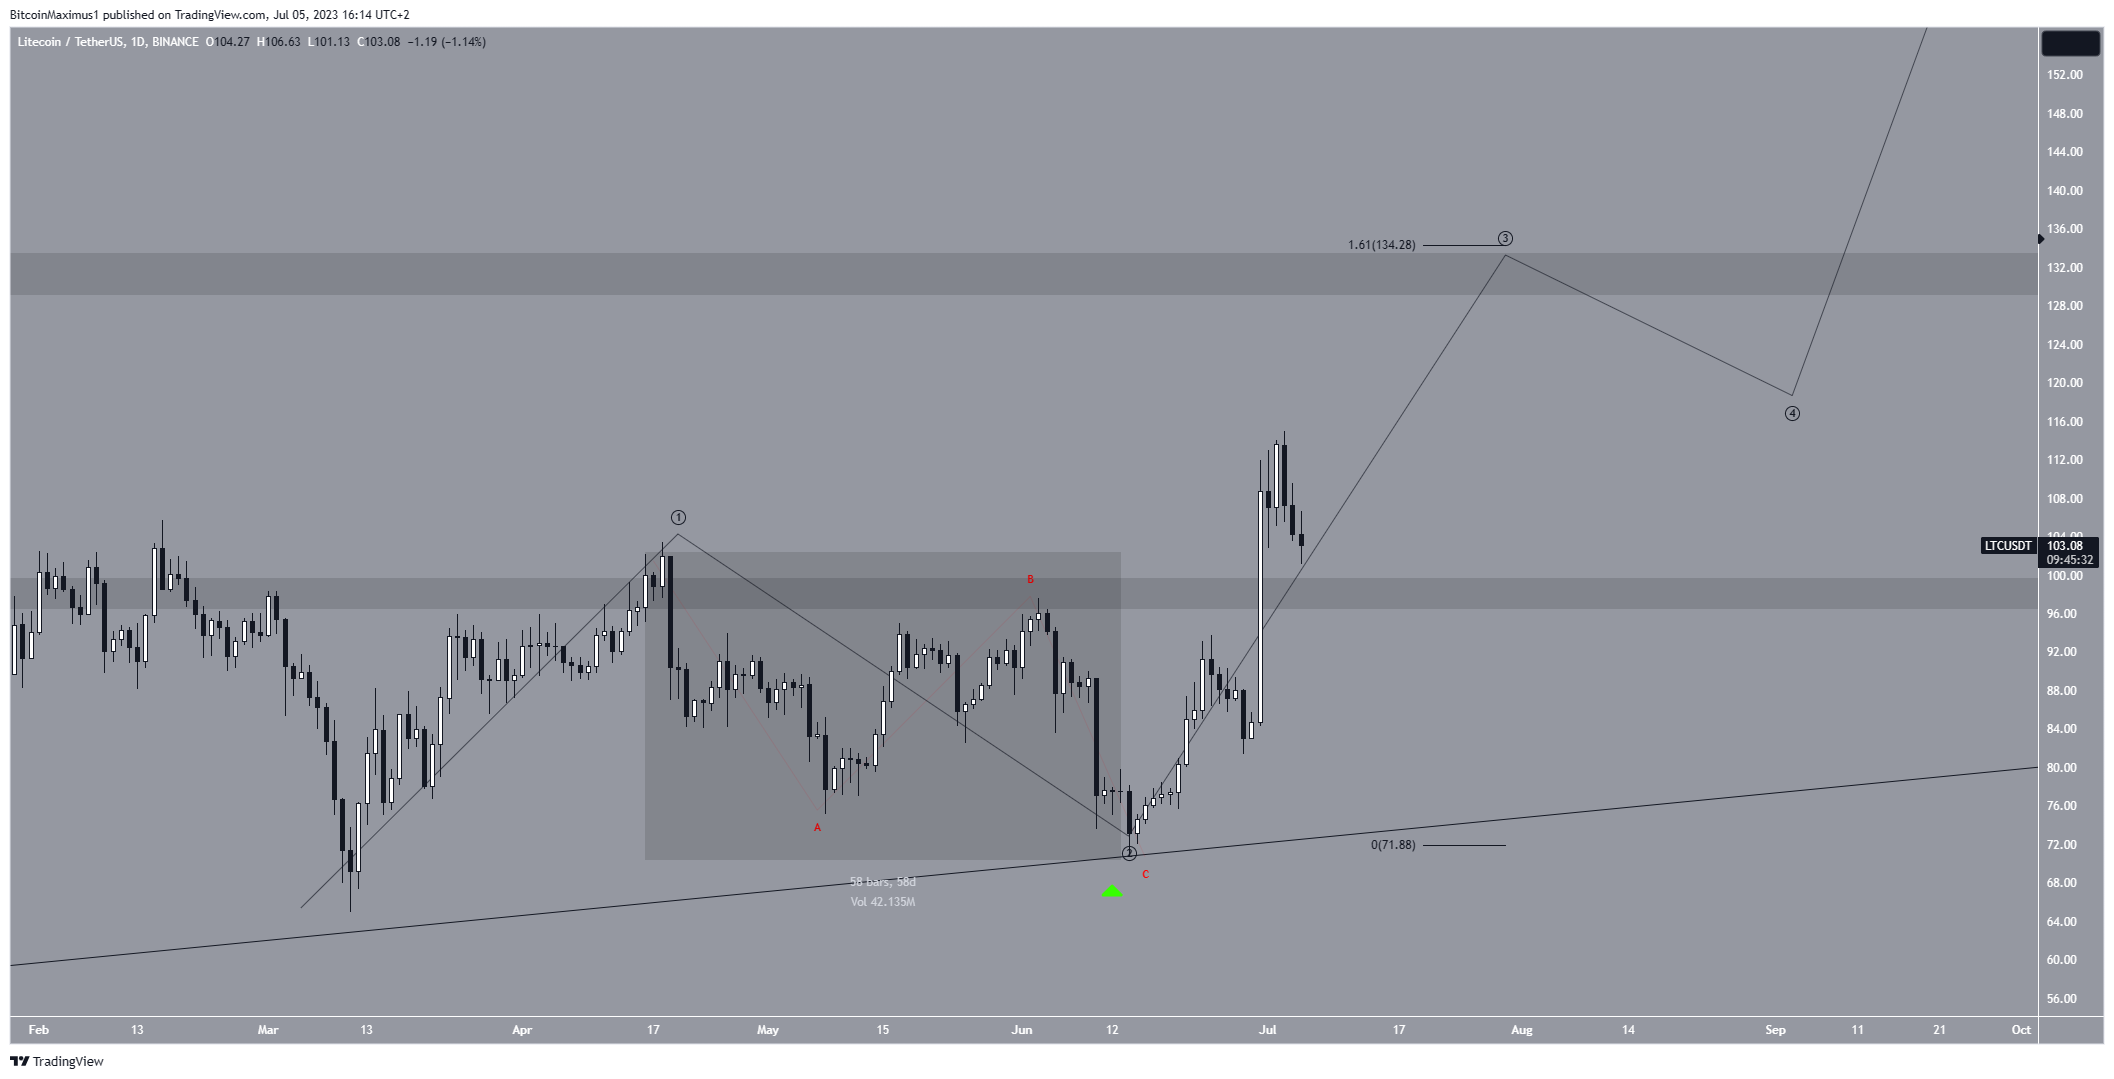
The price of Litecoin (LTC) finally overcame the horizontal resistance area of $100 and updated the annual high of $115 on July 3
Although the short-term dynamics suggest that a pullback may occur, the long-term indicators speak in favor of the continued growth of the LTC price to new highs.
Litecoin tested the bullish breakout level again
As the results of the technical analysis of the weekly chart show, the LTC picture is predominantly optimistic. There are several factors to support such a scenario.
To begin with, since May 2022, LTC has been trading under an ascending triangle pattern, which is generally considered bullish. Accordingly, such a pattern usually leads to bullish breakouts. In addition, the token has repeatedly tried to overcome the $100 resistance level.
The price began to rise after a rebound on June 15 from the support line (green icon). Last week, it broke through the $100 area and hit a new yearly high of $115.
Since then, the price of LTC has declined slightly, but it is possible that it is simply looking to test the strength of the $100 area as support, and then continue to rise.
In addition, the weekly Relative Strength Index (RSI) shows a bullish mood. Traders use the RSI as a momentum indicator to identify whether the market is overbought or oversold, which helps them decide whether to buy or sell an asset.
If the RSI values are above 50 and the trend is upward, it gives an advantage to the bulls, and vice versa. In this case, the RSI is above 50 and growing, which indicates a favorable situation for sellers
Moreover, it has formed a hidden bullish divergence (green line), which is a bullish continuation pattern and often leads to a continuation of an existing bullish trend
LTC Forecast: Wave Analysis Supports Rally
Meanwhile, the wave analysis of the daily chart outlines the bullish outlook. The most likely wave scenario suggests that LTC is in the third wave (black) of a five-wave bullish structure. Wave three usually has the largest magnitude of the five waves.
Thus, the shape of the bullish breakout is perfectly consistent with the possibility that the price is in the third waveMoreover, the corrective movement within the supposedly second wave (highlighted on the chart) fits perfectly into this scenario. Sub-waves A and C in this movement have a ratio of 1:1 (red).
The most likely target for the formation of the top of the third wave is at $135, which gives the 1:3 waves a ratio of 1:1.61. This will also take LTC to the long-term resistance area of $135, making it likely that a local top will form at that level.

Despite such a bullish outlook, closing LTC below the $100 horizontal area would mean that the bullish breakout turned out to be false.
In this case, the most likely scenario would be for the price to fall to the upward support line at $80