Polygon (MATIC) price made a breakout of the 140-day resistance line, but this breakout was not followed by any significant gains
Long-term and short-term indicators are not consistent with each other. While the daily timeframe indicates a decisive bullish breakout, the short-term outlook suggests that MATIC will make a bearish breakout instead.
Polygon broke through the 140-day resistance
As the results of the technical analysis of the daily chart show, MATIC gives bullish signals. Thus, the price made a bullish breakout of the downward resistance line, the age of which was 140 days.
A breakout of such long-term levels means that the previous movement has been completed and a new one has begun, in the opposite direction.
Despite this breakdown, MATIC has yet to launch any significant growth. Instead, it is trading very close to the levels that preceded the breakout.
Meanwhile, the Relative Strength Index (RSI) is also bullish, reinforcing the breakout. Recall that bulls have an advantage if the RSI values are more than 50 and the trend is upward, and vice versa.
In this case, the indicator rose above 50 when price made a breakout of the aforementioned line. This confirms the likelihood of a new bullish trend starting.
MATIC forecast: a key level that will determine the direction of the trend
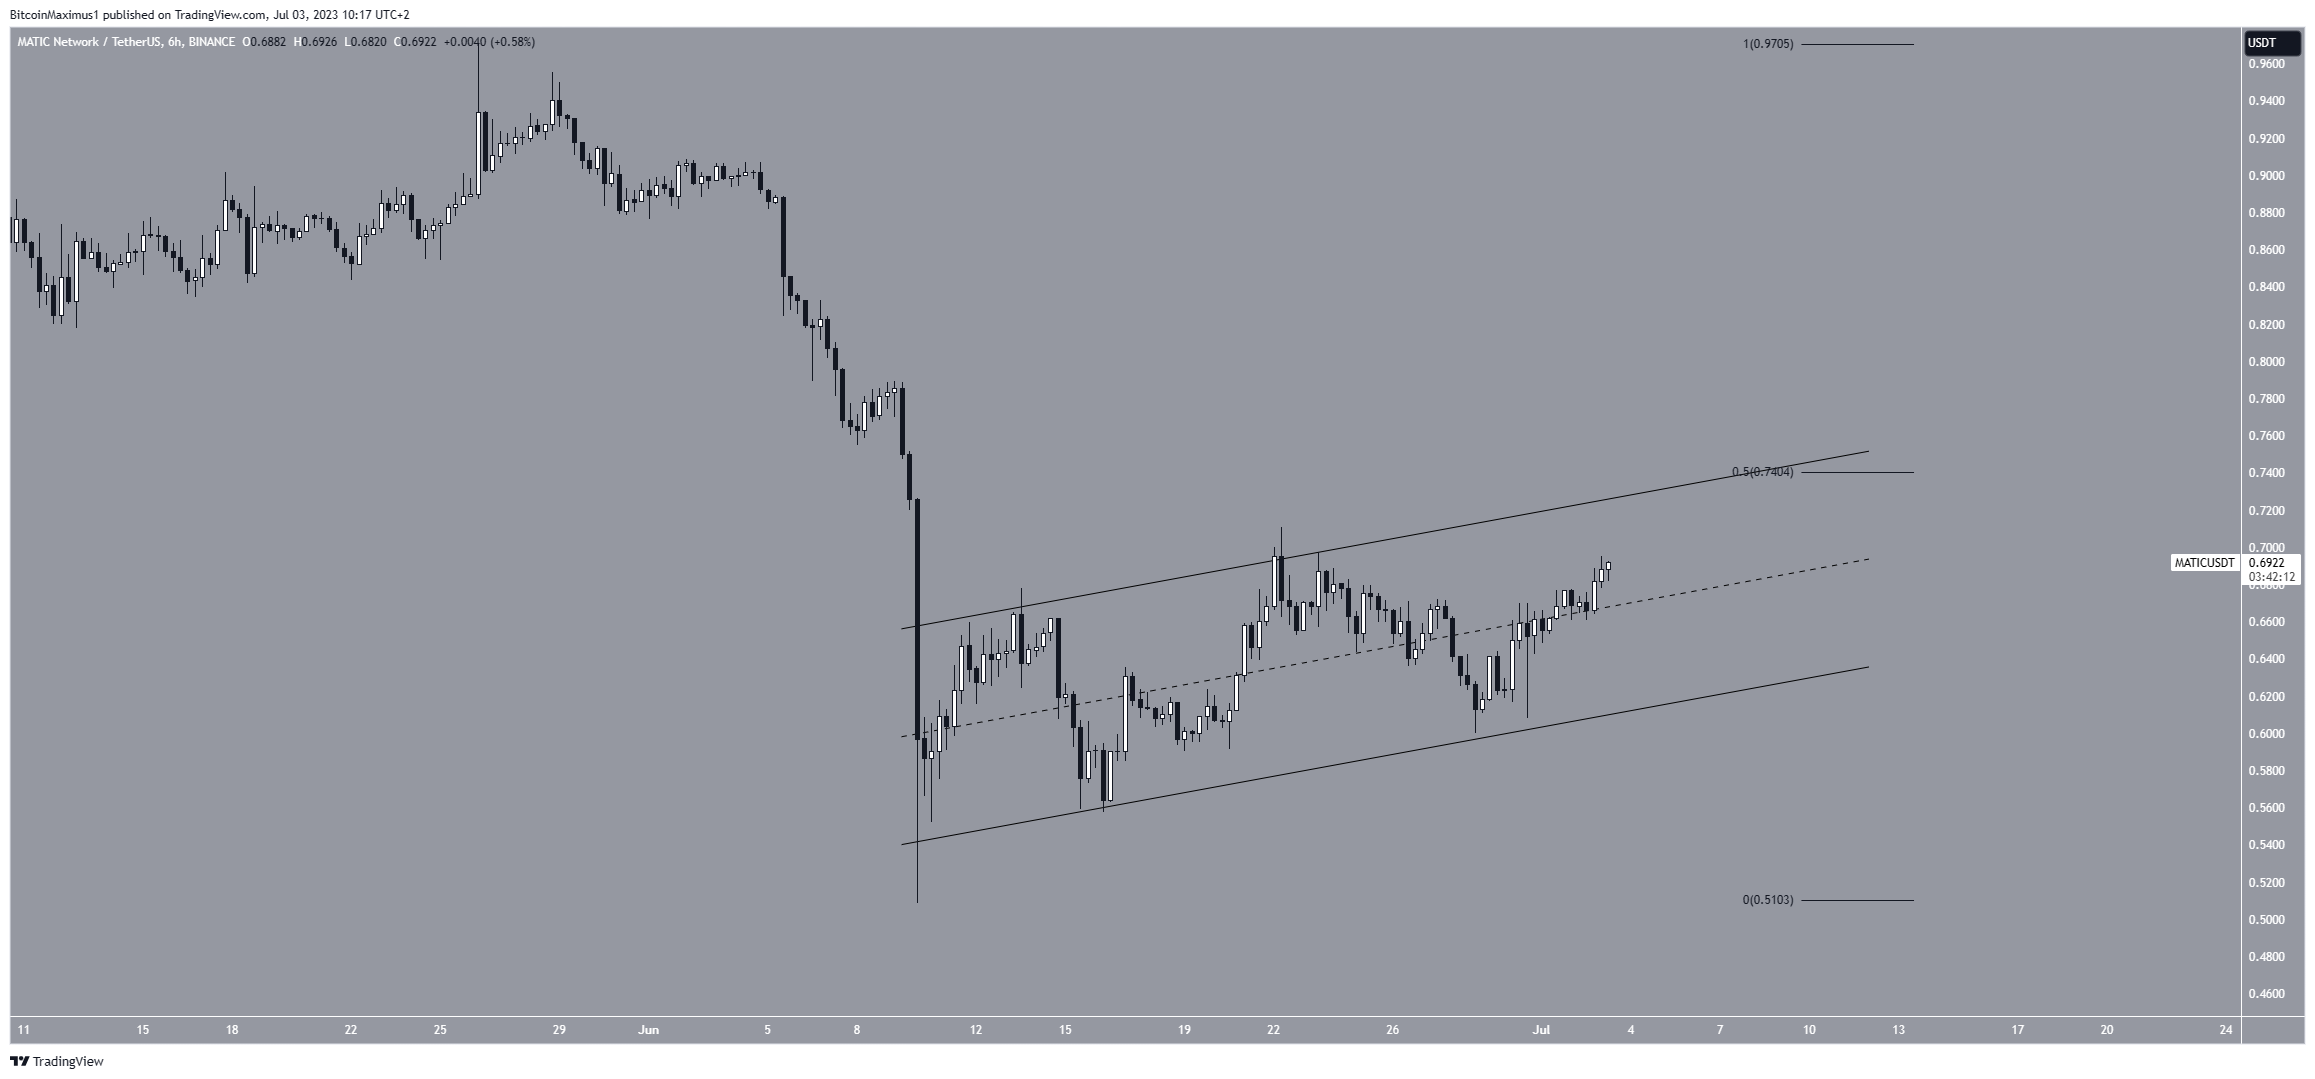
While the daily timeframe is decidedly bullish, the shorter-term six-hour chart casts doubt on the legitimacy of the breakout.
Although the price has been rising since June 10, it is inside the ascending parallel channel. This pattern is considered bearish, which may eventually end in a bearish breakout.
In addition, on July 12, the price of MATIC was pushed back from the area of convergence of resistance levels (red circle). The channel's resistance line and the 0.5 Fibo retracement level form resistance here.
Fibonacci levels are traditionally considered the most likely springboards for stopping and reversing the price after significant progress in any one direction As expected, at these levels, the market can win back part of the distance traveled and only after that resume movement in the original direction. In addition, they can determine the limit levels of the price movement.
Thus, the inability of the price to rise above the Fibo level of 0.5 may indicate that the upward movement is corrective and we are expecting a bearish breakout from the channel. If this does happen, then MATIC is likely to fall to the June 10 lows at $0.51.

Despite such a bearish short-term outlook, a breakthrough of the upper boundary of the channel and the resistance area of $0.74 would mean that the trend is bullish. In this case, MATIC could head towards the nearest resistance at $0.90.